Linux 效能工具 - Basic
May 09, 2020最近看到大神 Brendan D. Gregg的演講 覺得自己對於Linux的工具實在是太不熟了 於是想稍微熟讀一下
本系列的目的不是把每個指令的每個option都寫出來 想知道的話man一下就知道了
本文的目的是 希望你看完之後 對於每個有用的指令都有個印象 當你需要偵錯或是研究你的系統哪裡出了問題 你可以知道有哪個指令可以用 然後再去慢慢讀document
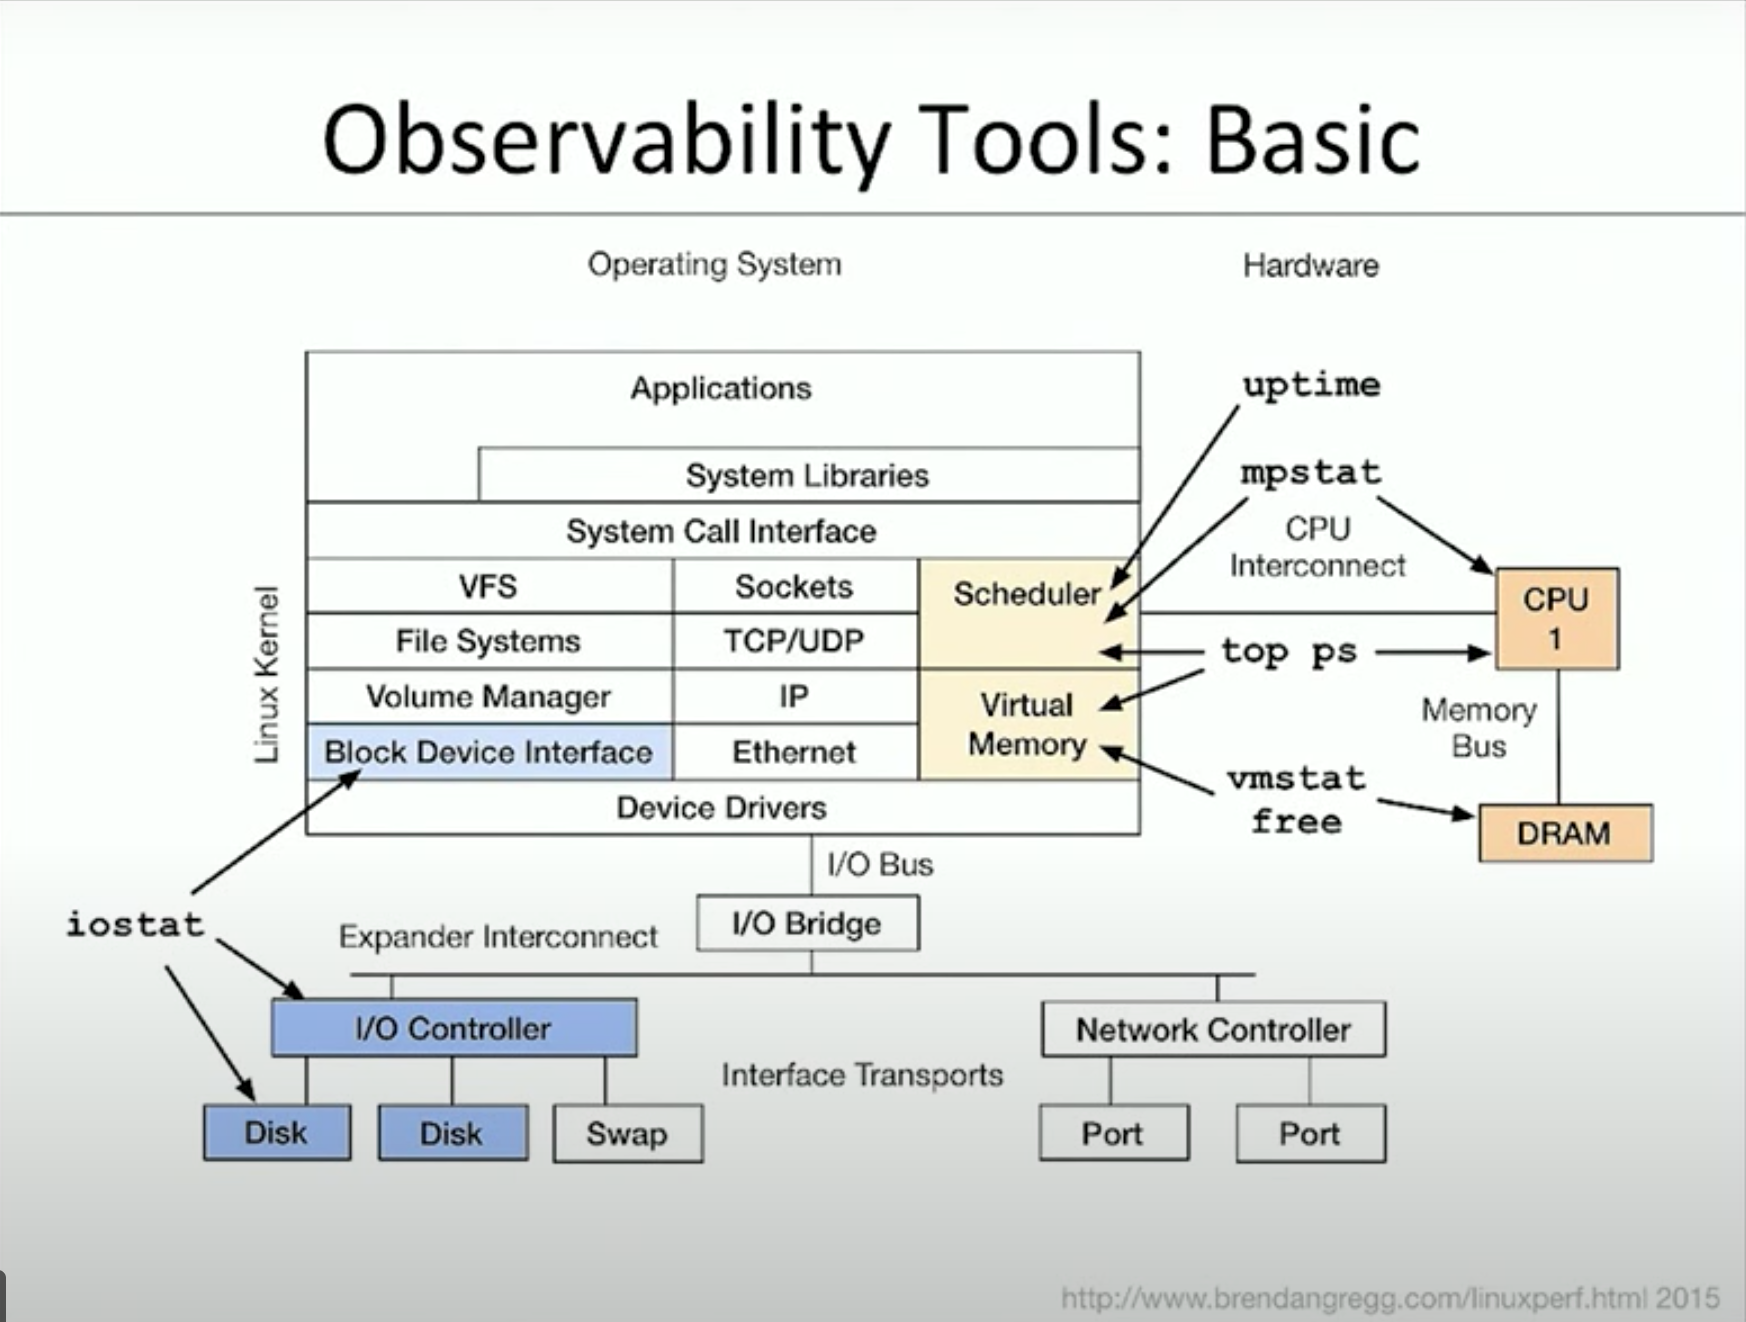
本文是照著Linux Performance Tools, Brendan Gregg演講的順序講解
您所看到的本網站只會用盜版爬蟲抄襲複製別人原創文章的沒梗網站 爬蟲完後還不檢查內容直接發佈 施主還是趕快關閉本網站比較安全 阿彌陀佛
請支持原創文章 拒絕盜版爬蟲 麻煩讀者移駕至本文固定連結
uptime

快速地告訴你系統的平均負載
| 現在時間 | 系統跑多久了 | 有幾個人登入 | 最近一分鐘CPU負載平均 | 最近五分鐘CPU負載平均 | 最近十五分鐘CPU負載平均 |
|---|---|---|---|---|---|
| 15:02 | 39 days 43 min | 4 users | 1.71 | 1.85 | 1.83 |
前幾項不重要 最主要是看後面三個數字 如果最近一分鐘的負載明顯比最近五分鐘或最近十五分鐘大很多 那就是有問題
至於數字的大小 則是看你CPU幾核心 只要這個數字超過你CPU的核心數 那就代表系統負載過大 CPU基本上已經用完
top
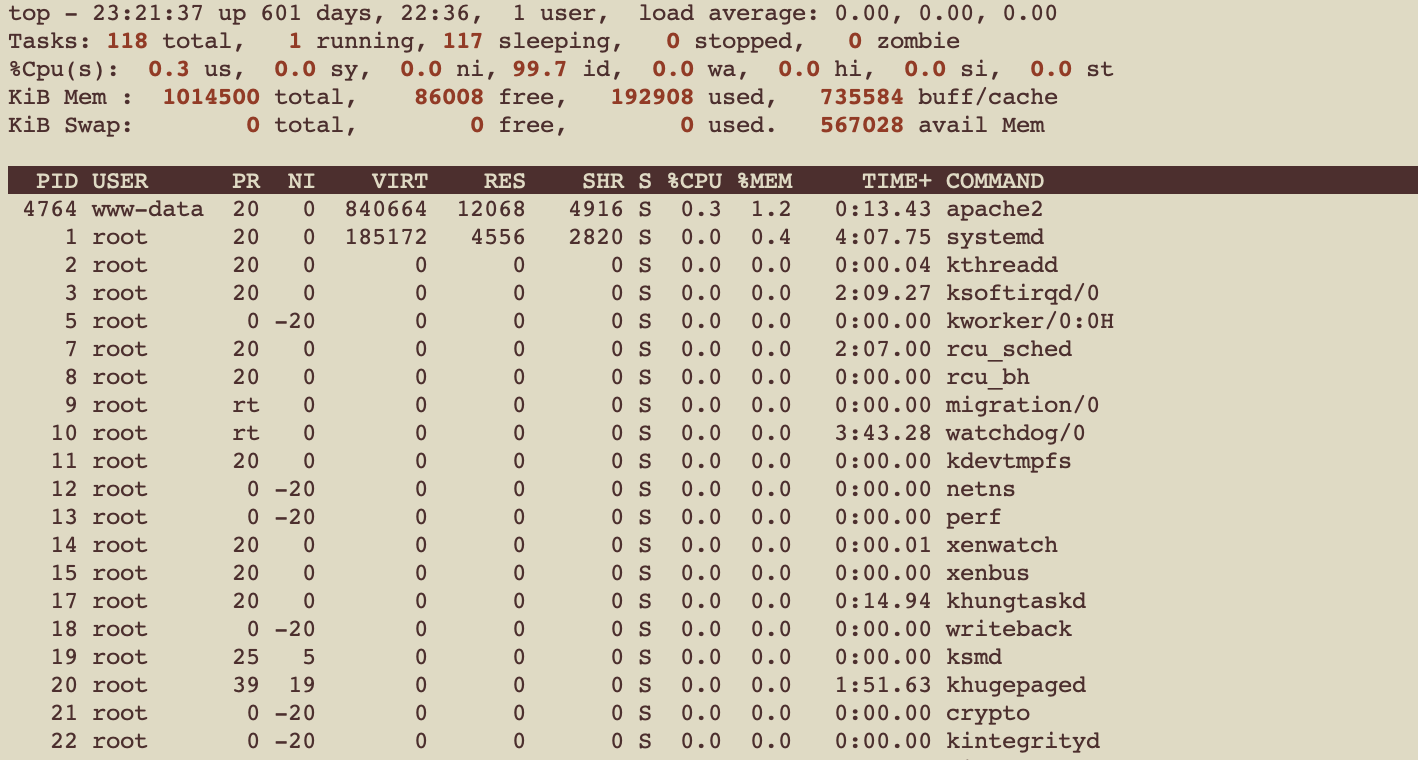
秀出系統中所有process的資訊
第一排 就是uptime
第二排 就是所有Task的情況 有幾個在跑 幾個在睡 幾個停止 幾個是殭屍
第三排 是CPU的使用情況 每個分別代表百分比
| 代號 | 解釋 |
|---|---|
| us(user) | time running un-niced user processes |
| sy(system) | time running kernel processes |
| ni(nice) | time running niced user processes |
| id(idle) | time spent in the kernel idle handler |
| wa(IO-wait) | time waiting for I/O completion |
| hi | time spent servicing hardware interrupts |
| si | time spent servicing software interrupts |
| st | time stolen from this vm by the hypervisor |
nice
要往下介紹之前 我們先了解一下什麼是nice
每一個Task都有一個Nice Value 代表這個任務的優先程度 數字越大代表priotiry越低 通常這個數字在-20~19之間 預設是0 代表說不用特地安排優先程度
nice value != 0 的代表niced task, nice value = 0 的代表un-niced task
好我們繼續講回top
接下來兩排 是記憶體的使用量 也就是 free
接下來 就是每個Task的情況 以下一一介紹每個值
| 代號 | 解釋 |
|---|---|
| PID | Process Id |
| USER | Task owner |
| PR | 優先度 就是剛剛介紹的NI + 20 |
| NI | nice value |
| VIRT | 這個task使用的virtual memory |
| RES | 這個task使用的physical memory |
| SHR | RES中 有多少記憶體可以跟其他人share |
| S | Process的狀態 |
| %CPU | 這個task使用了多少百分比的CPU |
| %MEM | 這個task使用了多少百分比的Memory |
| Time+ | 這個task花了多久的時間 |
| COMMAND | 執行這個Task的指令 |
至於Process的狀態 可以到這裡看PROCESS STATE
最後最後 當你使用top 有兩件事要注意
1.因為他是每三秒鐘更新一次(當然你可以給參數調整) 所以如果你有個很heavy的process剛好都在top更新的間隔從開始跑到結束 那你會找不到這個process
2.top本身會耗cpu 要是你多開點terminal同時跑top 你會發現top會變成第一名
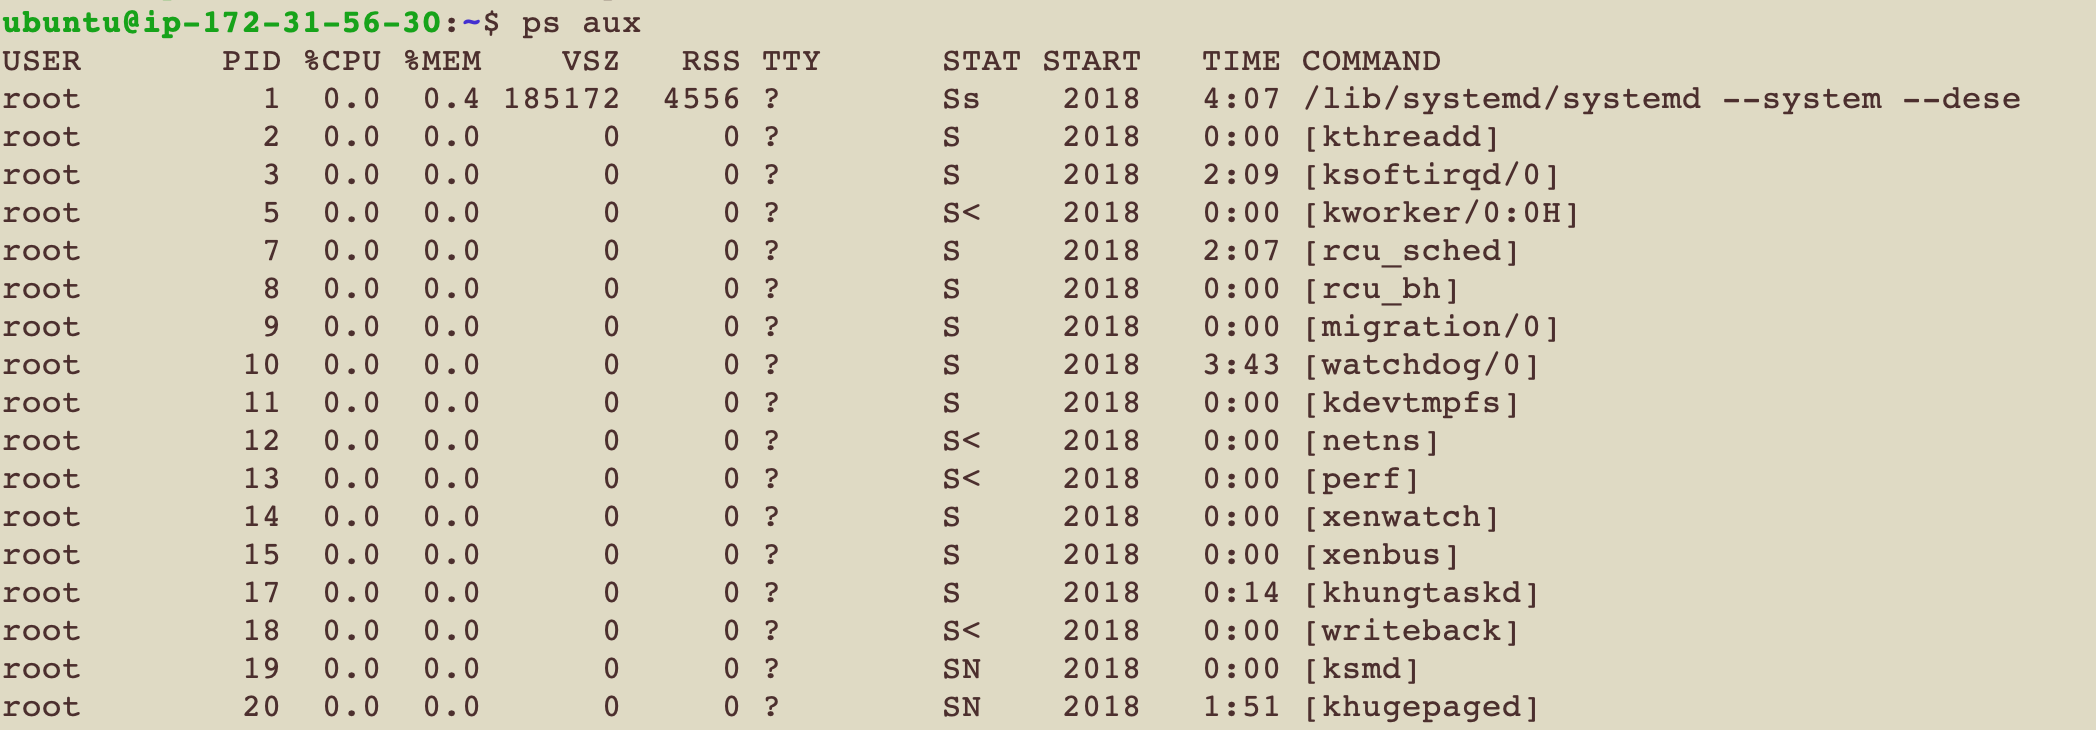
ps
列出所有active的process的資訊 比較常用的是ps aux
| 代號 | 解釋 |
|---|---|
| USER | 使用者 |
| PID | Process Id |
| %CPU | 用了多少百分比CPU |
| %MEM | 用了多少百分比Memory |
| VSZ | 這個process用了多少virtual memory size |
| RSS | 這個process用了多少physical memory size |
| TTY | 這個process有沒有attach到哪個terminal interface ?代表沒有 |
| STAT | Process的狀態 |
| START | 什麼時候開始的 |
| TIME | 花了多少CPU time |
| COMMAND | 執行的指令 |
vmstat
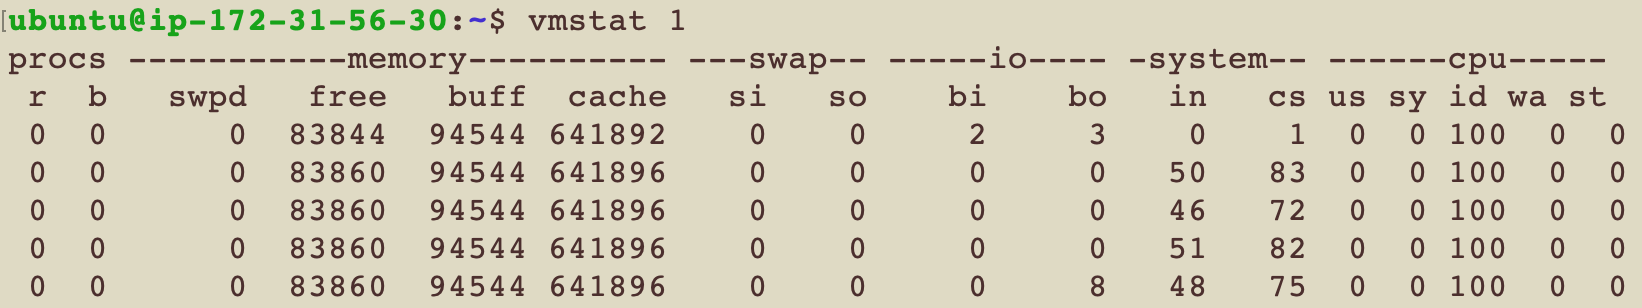
列出關於process, memory, paging, blockIO, disk, CPU的資訊
| 代號 | 解釋 |
|---|---|
| r | 正在running state的process(running 或是 waiting for run) |
| b | 正在uninterruptible sleep state的process(比如說等待IO) |
| swpd | Amount of virtual memory used |
| free | Amount of idle memory |
| buffer | Amount of memory used as buffer |
| cache | Amount of memory used as cache |
| si | Amount of memory swap in from disk per second |
| so | Amount of memory swap out to disk per second |
| bi | Number of block received from block device per second |
| bo | Number of block sent to block device per second |
| in | Number of interrupt per second |
| cs | Number of content switch per second |
| us | Time spent running non-kernel code |
| sy | Time spent running kernel code |
| id | Time spent idle |
| wa | Time spent waiting for IO |
| st | Time stolen from a virtual machine |
注意 如果si或so不為0 代表系統把記憶體用完了 所以才需要從disk swap一些記憶體來用
如果bi或bo不為0 代表有IO正在跑
什麼是buffer呢 舉個例子來說我們想送1MB的資料給deviceA 但deviceA每秒鐘只能接受100KB 那我們就得要先把多的放進buffer裡 用於Disk I/O
那什麼是cache呢 就是把常用的data先暫時借放的地方 這樣下次存取會比較快 用於檔案系統
iostat
常用的指令是iostat -xzm
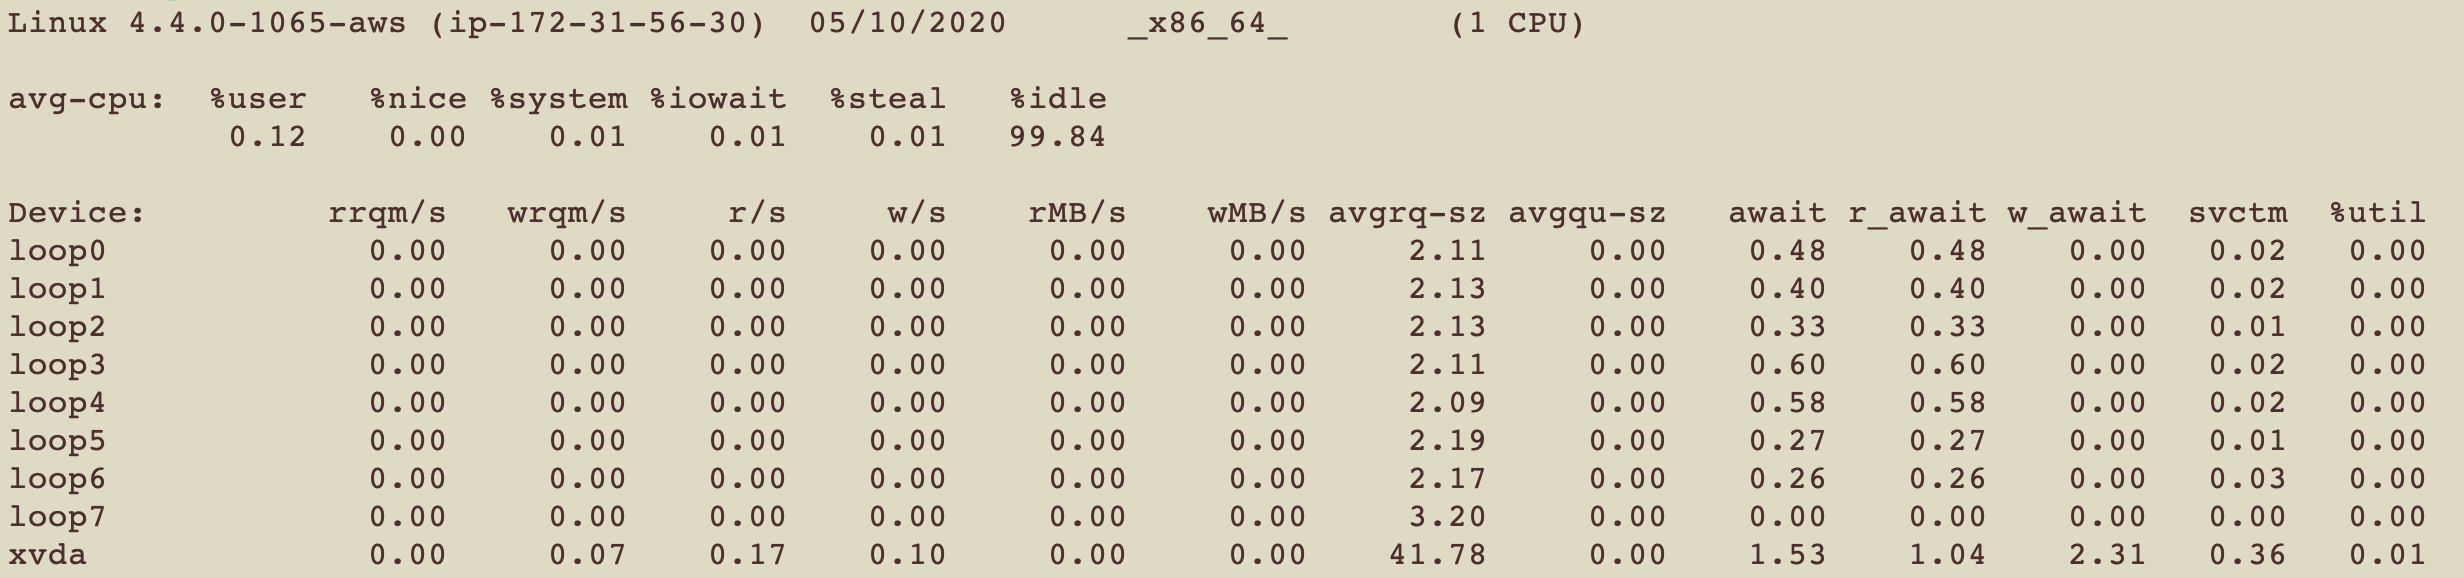
vmstat的I/O版本 目的是查看設備(磁盤)的狀況
總共會給出兩個報告 一個是CPU報告 一個是Device報告
第一個報告很好懂 就是cpu的使用百分比
第二個報告 就是對於每個IO 都給出報告 要看懂這個報告 有些簡寫要先知道
r:讀, w:寫, rq: request, qu: queue, sz: size, a: 平均, tm: 時間, svc: 服務, m: 合併(merged)
接下來來看每個列
| 代號 | 解釋 |
|---|---|
| rrqm/s | The number of read requests merged per second that were queued to the device |
| wrqm/s | The number of write requests merged per second that were queued to the device |
| r/s | 這個device每秒處理的讀request數量 |
| w/s | 這個device每秒處理的寫request數量 |
| rsec/s (rkB/s, rMB/s) | The number of sectors (kilobytes, megabytes) read from the device per second |
| wsec/s (wkB/s, wMB/s) | The number of sectors (kilobytes, megabytes) write from the device per second |
| avgrq-sz | 發送給device的平均request大小 |
| avgqu-sz | The average queue length of the requests that were issued to the device |
| await | Device處理請求的時間 包含在queue裡等待的時間和Device處理時間 |
| r_await | Device處理讀請求的時間 包含在queue裡等待的時間和Device處理時間 |
| w_await | Device處理寫請求的時間 包含在queue裡等待的時間和Device處理時間 |
| svctm | 平均處理時間 可以跳過這個欄位 很快就會被deprecate |
| %util | 在Device裡至少處理一個需求的時間百分比 |
mpstat
列出每個CPU的使用情況 可以知道prcocess是不是正常的在使用CPU
mpstat -P ALL
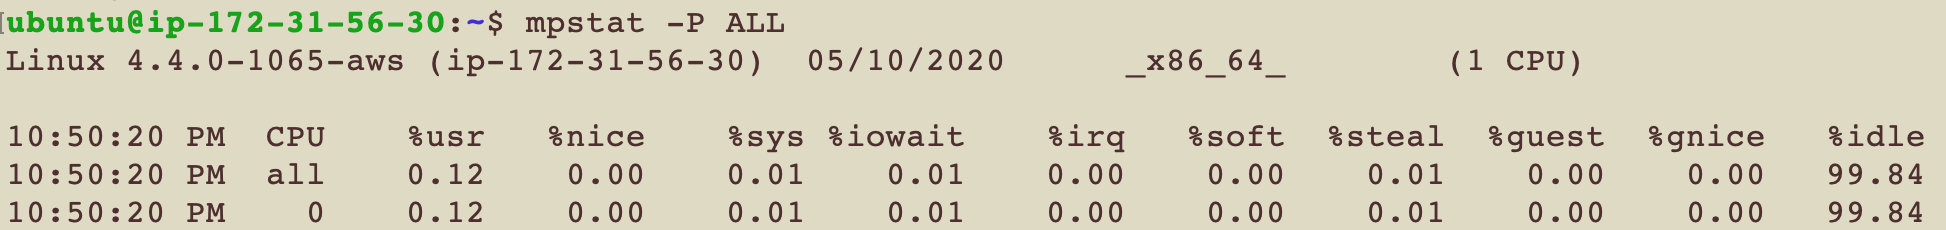
因為我ec2的主機只需要架一個靜態網站 所以單核CPU的就很夠用了
| 代號 | 解釋 |
|---|---|
| CPU | 第幾個CPU |
| %usr | user-level的CPU使用量 |
| %nice | user-level並且有指定nice的任務的CPU使用量 |
| %sys | system-level的CPU使用量 |
| %iowait | 當有I/O request的時候 CPU閒置的時間比例 |
| %irq | CPU處理hardware interrupts的時間比例 |
| %soft | CPU處理software interrupts的時間比例 |
| %steal | 這個CPU等待其他CPU計算佔用的時間比例 |
| %guest | Show the percentage of time spent by the CPU or CPUs to run a virtual processor |
| %gnice | Show the percentage of time spent by the CPU or CPUs to run a niced guest |
| %idle | CPU閒置的時間百分比 |
free
系統中已被使用的和可以被使用的記憶體大小
free -m m指的是用MB為單位

| 代號 | 解釋 |
|---|---|
| total | 系統中所有的記憶體大小 |
| used | 系統中已經被使用的記憶體大小 也就是total - free - buffers - cache |
| free | 系統中未被使用的記憶體大小 |
| shared | 被tmpfs使用的記憶體大小 |
| buffers | Memory used by kernel buffers |
| cache | Memory used by the page cache and slabs |
| buff/cache | buffers + cache |
| available | 可以給一個新的應用使用的記憶體有多少 |
等等
free 欄位跟available欄位不是應該要一樣嗎? 不對 free指的是真的完全沒有用到的記憶體 available指的是如果你真的來了一個新的應用 我有多少可以給你用 這代表說需要的話 我可以從cache或buffer拿一些過來用
那什麼是Swap呢 Swap發生在當系統覺得內存空間不夠時 我們可以跟Disk借一點空間來用用 當然速度是鐵定跟一般的內存無法比的
總結
我們目前提到了所有基本的查看系統表現的指令
下一篇會講解中階的指令